Healthy food
Production of California livestock and agricultural crops has increased since 1980, accompanied by greater N fertilizer application.
Between 1980 and 2007, production of vegetables and melons, and fruits and nuts increased 128% and 17% respectively, reflecting shifts in the diet composition of the US population. To meet increasing demands for animal protein, feed crops was also one of the highest crop production categories, almost tripling over this period. Correspondingly, livestock production was on an increasing trend, with the average annual milk cow and heifer population doubling.
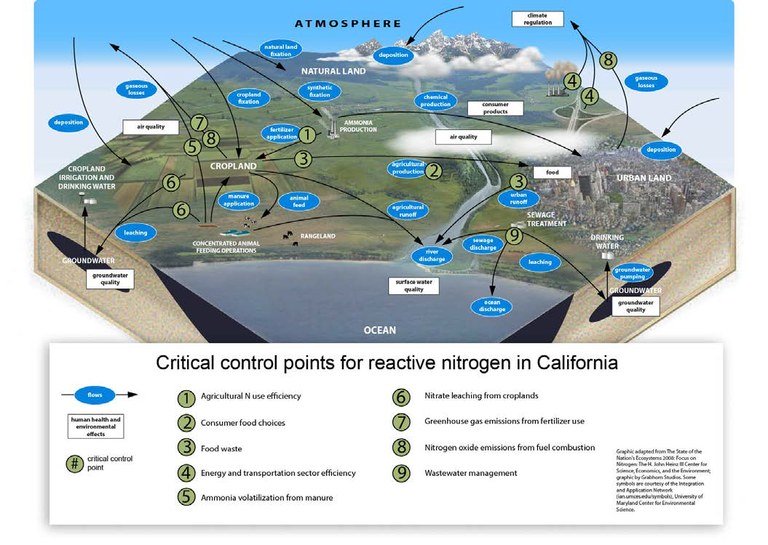
While N is indispensable in increasing the production of agricultural systems, much of the N applied is lost to the environment, resulting in a variety of impacts on atmospheric, terrestrial, and aquatic ecosystems.
The difference between the tonnes of N fertilizer applied and N harvested is on a decreasing trend for cotton since 1980. However, the estimated amount of N that is not taken up by crops is on a slightly increasing trend for vegetables, fruits and nuts. This corresponds to the amount of fertilizer applied by crop, with estimated application rates on many vegetable and fruit and nut crops having increased in recent decades, at the same time as the total acreage for these crops has also increased.
California’s agricultural sector is important to the state’s economy and also contributes significantly to the provision of food security for the United States and globally.
California’s agricultural economy is the largest in the US with over $37.5 billion in earnings in 2010, producing 21% of the nation’s dairy commodities and more than 50% of the fruits and vegetables. The state is also the largest producer of ornamental horticultural goods in the US with $2.3 billion in wholesale sales and $235 million in retail sales in 2009.
Clean drinking water
The concentration of nitrate in California’s surface water bodies seldom exceeds the federal maximum contaminate level (10 mg nitrate-N L-1).
As such, the use of surface water sources for drinking is generally considered low risk.
Nitrate levels in groundwater have increased over the past several decades, and in some parts of the state now exceed federal drinking water standards.
This trend is likely to continue due to the time lag between the loss of nitrogen (N) to the environment and its accumulation in aquifers.
People in agricultural areas, particularly those with domestic wells, are more likely to be exposed to high levels of nitrate in their drinking water than those in urban and suburban areas.
Groundwater from wells in the Tulare Lake Basin and Salinas Valley regularly exceed the federal MCL and an estimated 8.0-9.4% of residents (212,500 – 250,000 people) in these areas are “highly susceptible” to exposure to water in excess of 10 mg nitrate-N L-1.
For most adults, the amount of nitrate and nitrite consumed via foods is much greater than the amount consumed through drinking water.
Infants given water or foods high in nitrate can develop “blue-baby syndrome”, a potentially fatal condition where their blood cannot transport oxygen.
The International Agency for Research in Cancer concluded that nitrate and nitrite are “probably carcinogenic to humans”.
Nitrate and nitrite can form nitrosamines, which are suspected to cause cancer. Consumption of nitrate and nitrite from all drinking water and food sources such as preserved meats is associated with stomach cancer in some studies.
Nitrate and nitrite can have positive effects on the body.
In some patients they are used to treat high blood pressure and reduce the risk of stroke.
Costs of treating nitrate contaminated drinking water can pose a significant financial burden on low-income households and the public and community water systems that serve disadvantaged communities.
While state-wide estimates of the cost to address nitrate in public and community water systems are needed, recent studies suggest that an increase in public and private funding on the order of $17 – 34 million per year over many decades will be needed to implement required nitrate mitigation projects for water systems in the Tulare Lake Basin and Salinas Valley.
Clean air
Nitrogen is a component of, or aids in the formation of, five known air pollutants including NOx, NH3, O3, PM2.5 and PM10.
Air pollutants have important impacts on the economy, the environment, and human health, and thus are regulated by state and federal agencies.
Major emissions sources include the combustion of fossil fuels in the transportation, energy generation and industrial sectors, as well as agricultural fertilizers and livestock.
Higher NOx concentrations tend to be measured in and around California’s urban areas and originate mostly from the transportation and industrial sectors. Concentrations of ground level O3, which is formed from emissions of NOx and volatile organic compounds (VOCs), are highest during the summer months in the South Coast, Bay Area and Central Valley regions. The majority of NH3 emissions come from livestock waste and N fertilizers, thus concentrations of NH3 tend to be higher in the southern part of California’s Central Valley.
Levels of PM2.5 and PM10 are highest in the South San Joaquin Valley and South Coast regions.
In the San Joaquin Valley, where livestock activities occur, NH3 is the dominant constituent of secondary particulate matter. In the urban areas of the South Coast, compounds formed from NOx make up a larger fraction of the particulate matter.
Air quality regulations and technological innovations have led to significant declines in NOx, O3, PM2.5 and PM10 over the past four decades.
However, much of the state still has air quality that fails to meet one or more of the standards set by national and state agencies to protect human health.
There are important racial disparities in exposure to air pollutants.
In the South Coast and San Joaquin Valley Air Basins, a larger percentage of the Black and Hispanic populations relative to White and other races are exposed to PM2.5 concentrations that are above the national ambient air quality standard (35 µg/m3).
Air pollutants are associated with many health problems.
These include difficulty breathing, reduced lung function, asthma, respiratory infections, chronic obstructive pulmonary disease, cardiovascular disease, overall deaths, and deaths due to specific respiratory and cardiac causes. In California, over 12,000 premature deaths per year from cardiopulmonary disease and ischemic heart disease are attributed to elevated PM2.5 levels. Studies suggest that the health damages in California associated with poor air quality are on the order of tens of billions of dollars per year.
Air pollution, particularly O3, has adverse effects on crop growth.
Yield losses ranging from 1 – 33%, depending on the sensitivity of the crop and level of exposure, can reduce revenues for agricultural producers and increase food costs for consumers. The overall economic impact of O3 on agricultural production in California is estimated to be on the order of hundreds of millions of dollars per year.
Climate regulation
Human activities that increase reactive N have numerous competing effects on the ecosystem and biogeochemical processes that regulate the Earth’s climate.
Some processes have net warming effects that exacerbate climate change, while other processes have net cooling effects that partially offset the prevailing trend of a warming climate.
Emissions of N2O have a long term warming effect on global climate change.
As the third most important greenhouse gas behind CO2 and CH4, N2O accounts for approximately 8% of total global and 3% of total statewide greenhouse gas emissions. The vast majority of N2O emissions emitted globally and in California come from agricultural sources (N fertilizers, livestock, N2-fixing crops), while fossil fuel combustion, sewage treatment and industrial sources are also minor sources.
N deposition and fertilization tends to have an overall cooling effect on climate by enhancing terrestrial C sequestration in plant biomass and soils.
Increased C sequestration due to N input has been documented for many forest, grassland, wetland and agricultural ecosystems in North America (24 - 177 kg C per kg N deposited per year), a trend which has also been observed in California.
The formation of O3 from NOx has both warming and cooling effects on the earth’s climate.
Increased ground-level O3 has adverse effects on plant photosynthesis and CO2 uptake, which decrease C sequestration by crops and natural vegetation. While estimates suggest that O3 decreases plant C sequestration by 14 -23% globally, more research is needed to quantify the extent of this impact in California. In contrast, O3 can also have a small cooling effect on climate by increasing the concentration of hydroxyl radicals (OH), which in turn reduce the lifetime and overall burden of CH4 in the atmosphere.
Atmospheric aerosols formed from NOx and NH3 have a short term cooling effect on climate by reflecting and scattering solar radiation and stimulating cloud formation and the albedo effect.
Since the formation of aerosols from NOx and NH3 are generally linked to different pollution sources (e.g., fossil fuel to NOx, livestock to NH3), the relative contribution of each pollutant and the chemical composition of resulting aerosols is likely to vary considerably across California’s landscape.
Estimates suggest that anthropogenic sources of N have a modest net-cooling effect on the Earth’s climate in the near-term (20 years), but a net warming effect in the long-term (100 years) as the prolonged effects of N2O dominate the radiative balance.
It should also be noted that the overall effects of N on the climate are relatively small compared to CO2 from fossil fuel combustion (8% globally, 3-4% in California).
Cultural Services
Human induced changes in the N cycle have numerous positive and negative effects on the cultural services that are provided to society through natural and working landscapes.
Key services influenced by reactive N include the aesthetic value, recreational value, cultural heritage values, and spiritual and religious values of certain landscape elements and characteristics.
Shifts between natural, agricultural and urban land uses all made possible through N fertilizers and fossil fuel, have significant impacts on the aesthetic appearance of both natural and man-made environments in California.
Studies suggest that most people prefer the visual appearance of environments along the following land use gradient: natural habitat > diversified agricultural > agricultural monoculture > urban > industrial.
Loses of N to aquatic and terrestrial ecosystems through runoff and air pollution have a number of adverse effects on recreational opportunities in California.
Recreational opportunities such as fishing, hunting, hiking and bird watching are diminished because N losses tend to promote ecologically harmful eutrophication and anoxia in surface water bodies, and increases in N deposition on native grassland and forest ecosystems. These changes in N availability generally reduce native biodiversity and subsequent recreational opportunities.
Agritourism, culinary travel and other rural recreational activities (e.g. vineyards, u-pick farms) are examples of some of the benefits of N fertilizer and fossil fuel use.
Recent research indicates that opportunities for agritourism have been expanding in recent years with numerous ancillary benefits for job creation and economic growth in California’s rural areas.
Excess N in the environment can have detrimental impacts on native species, biodiversity, and natural and working landscapes, thus diminishing their natural heritage value to society.
Many of these elements of our natural environment are prominent subjects of nature study, literature, and other aspects of our cultural heritage.
Many religious traditions consider important species, locations, or geographic features to be “sacred”.
To the extent that N impacts biodiversity and ecosystem change, the spiritual and religious value that people derive from these species and places may be diminished.
Shared cultural and spiritual values can also be a key source of motivation and inspiration for environmental stewardship.
While this potential exists, more work is needed to determine effective ways to couple local cultural and spiritual values with sound science and public policy.
Studies in this field rarely attach monetary (or even quantitative) values to cultural services.
Like much of the rest of the world, there is very little quantitative evidence for California on cultural services generally and even less on cultural services specifically linked to N flows. The authors have made an effort to include in the text all those cases where they have found quantitative evidence, which is presented along with appropriate use of controlled vocabulary regarding uncertainty. The authors believe this approach is preferable to omitting these important (yet difficult to quantify and monetize) considerations.
![]()
